
はじめに
みなさんこんにちわ!
前ブログでは Elasticsearch 5.1.1 と Kibana 5.1.1 をインストールしてやったので、実際に何か可視化しなきゃとプレッシャーに押しつぶされそうになりながらこのブログを書いています。
という事で決めました。ELK (Elasticsearch + Logstash + Kibana) を使って Apache Log を Tile map で可視化する事にします!
概要
Logstash 5.1.1 のインストール。(Elasticsearch 5.1.1 と Kibana 5.1.1 のインストールは前ブログでやったので割愛)
Elasticsearch 5.1.1 のテンプレート投入。
Kibana の Visualize で Tile map を表示。
実行環境
Amazon Linux AMI release 2016.09
t2.medium (今回も贅沢に行きます)
前提として、Elasticsearch 5.1.1 と Kibana 5.1.1 はインストール済みとします。(インストール方法は過去ブログを見てください。https://www.skyarch.net/blog/?p=9668 )
インストール
いつものように公式サイトへ。
https://www.elastic.co/downloads
今回のお目当て Logstash!
https://artifacts.elastic.co/downloads/logstash/logstash-5.1.1.rpm
ELK で全てバージョン統一されているんですねー。
fluentd にサヨナラを告げながら yum install !
yum install https://artifacts.elastic.co/downloads/logstash/logstash-5.1.1.rpm
Java は前回入れたので飛ばします。
Logstash 設定
Logstash を設定。
設定ファイルは /etc/logstash/conf.d/ 配下に設置します。設定ファイルの読み込みに関する設定は /etc/logstash/logstash.yml に記載されています。
vi /etc/logstash/conf.d/10_apache_access_log.conf

-------------------------------------------------
input {
  file {
  path => "/tmp/access_log"
  start_position => "beginning"
  }
}

filter {
  grok {
  match => { "message" => "%{COMBINEDAPACHELOG}" }
  }
  date {
  match => ["timestamp", "dd/MMM/YYYY:HH:mm:ss Z"]
  }
  geoip {
  source => ["clientip"]
  }
}

output {
  elasticsearch {
  hosts => ["localhost:9200"]
  index => "access_log-%{+YYYYMMdd}"
  }
}
を記載して保存。
今回は grok-pattern "%{COMBINEDAPACHELOG}" を使用して match を設定します。既に Apache の combined 形式がサポートされているなんて、嬉しいですね!
あとは忘れちゃいけない geoip を使います。(詳細は https://www.elastic.co/guide/en/logstash/current/plugins-filters-geoip.html を参照。)
Apache Log は logstash ユーザーからでも読み込めるように /tmp へ放り込んでいます。
テンプレート投入
いつも Elasticsearch にマッピングお願いしていますが、今回はテンプレートを初めて投入します。(ドキドキ)
まずキモとして、geoip.location (経度緯度) という Field の type が geo_point でなければならない点があります。
geoip を有効にすると、"%{COMBINEDAPACHELOG}" でパースされた clientip (接続元 IPアドレス) を元に、geoip データベースで解析してくれます。
city_name, country_code, timezone など多様な情報が取得されます。
取得された情報は Field として扱う事ができるのですが、そのまま Elasticsearch にマッピングをお願いすると type が float となってしまいます。
そこで、geoip.location の type を geo_point として扱えるテンプレートを投入しようというのが今回の流れです。(初心者なので間違ってたらすいません。)
まずはじめにやった事は、"%{COMBINEDAPACHELOG}" がどのようにマッピングされたかを下記コマンドにて確認。
curl -XGET localhost:9200/_mapping?pretty
ずらずらと出力されていますね。
肝心の geoip.location はというと
-----------------------
    "geoip" : {
      "properties" : {
        "city_name" : {
          "type" : "text",
          "fields" : {
            "keyword" : {
              "type" : "keyword",
              "ignore_above" : 256
            }
          }
        },
        "continent_code" : {
          "type" : "text",
          "fields" : {
            "keyword" : {
              "type" : "keyword",
              "ignore_above" : 256
            }
          }
~~~~~~~~~~~~省略~~~~~~~~~~~~
        "latitude" : {
          "type" : "float"
        },
        "location" : {
          "type" : "float" ← ここ★
        },
        "longitude" : {
          "type" : "float"
        },
        "postal_code" : {
          "type" : "text",
          "fields" : {
            "keyword" : {
              "type" : "keyword",
              "ignore_above" : 256
            }
          }
~~~~~~~~~~~~省略~~~~~~~~~~~~
    "timezone" : {
      "type" : "text",
      "fields" : {
        "keyword" : {
          "type" : "keyword",
          "ignore_above" : 256
        }
      }
    }
  }
},
-----------------------
しっかりと type が float になってますね。
上記コマンドから得た結果を元にテンプレートを作ってみました。
vi es_templete.json
-------------------------
{
  "template" : "access_log-*",
  "mappings" : {
    "logs" : {
      "properties" : {
        "@timestamp" : { "type" : "date" },
        "@version" : { "type" : "text" },
        "agent" : { "type" : "text" },
        "auth" : { "type" : "text" },
        "bytes" : { "type" : "text" },
        "clientip" : { "type" : "text" },
        "geoip" : {
          "properties" : {
            "city_name" : { "type" : "text" },
            "continent_code" : { "type" : "text" },
            "country_code2" : { "type" : "text" },
            "country_code3" : { "type" : "text" },
            "country_name" : { "type" : "text" },
            "ip" : { "type" : "text" },
            "latitude" : { "type" : "float" },
            "location" : { "type" : "geo_point" },
            "longitude" : { "type" : "float" },
            "postal_code" : { "type" : "text" },
            "region_code" : { "type" : "text" },
            "region_name" : { "type" : "text" },
            "timezone" : { "type" : "text" }
          }
        },
        "host" : { "type" : "text" },
        "httpversion" : { "type" : "text" },
        "ident" : { "type" : "text" },
        "message" : { "type" : "text" },
        "path" : { "type" : "text" },
        "referrer" : { "type" : "text" },
        "request" : { "type" : "text" },
        "response" : { "type" : "text" },
        "timestamp" : { "type" : "text" },
        "verb" : { "type" : "text" }
      }
    }
  }
}
,
とりあえず、geoip.location の type を geo_point に変更しました。それ以外は何も変えてません。(これでいけるのか?)
投入する際は、インデックスを削除してからにしましょうね。
インデックス削除は
curl -X DELETE 'localhost:9200/*'
で一掃できます。怖いコマンドですからご利用は計画的に。
いざ投入!
curl -XPUT localhost:9200/_template/apache_access_log --data @es_templete.json
確認
Kibana を覗いてみよう!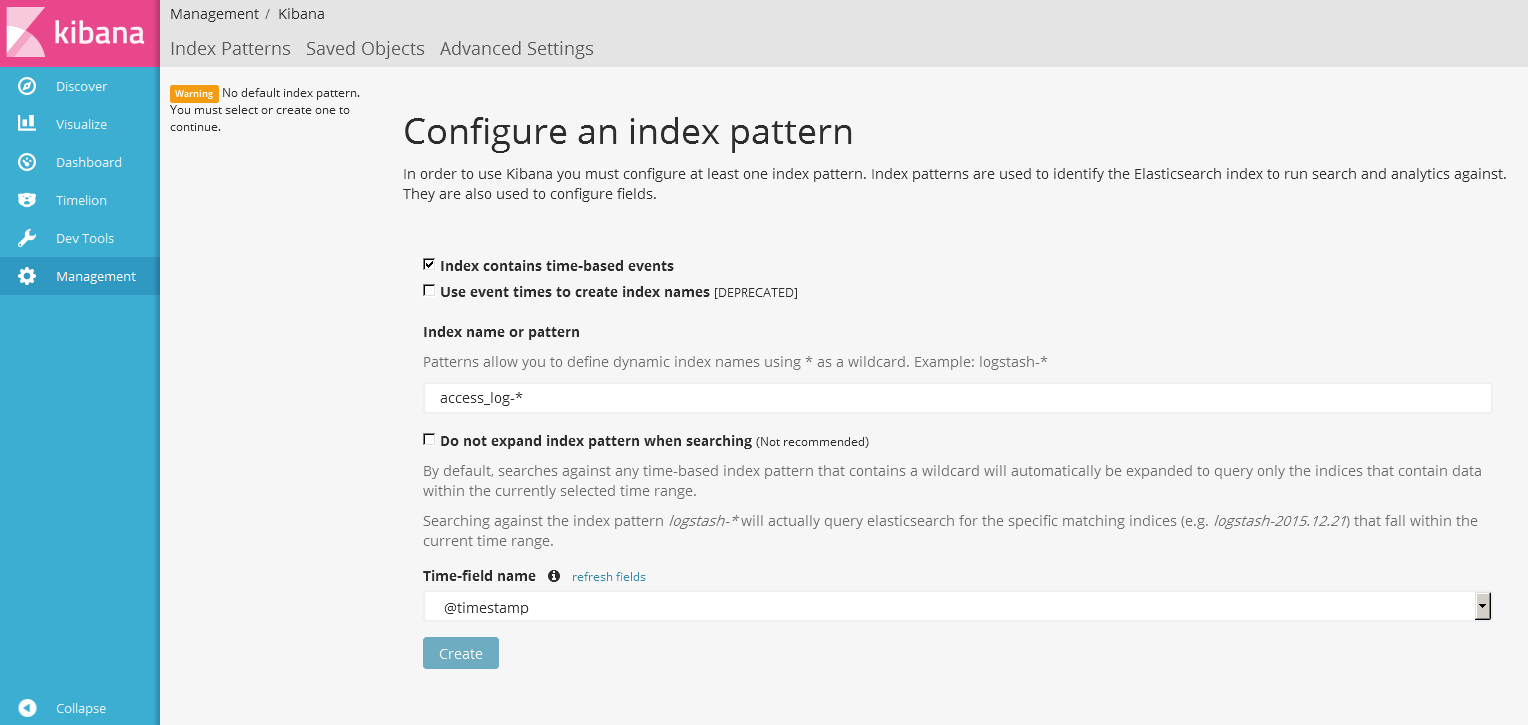 Index name or pattern へ今回指定したインデックス名を入れます。
Time-field name は @timestamp を選択して Create!
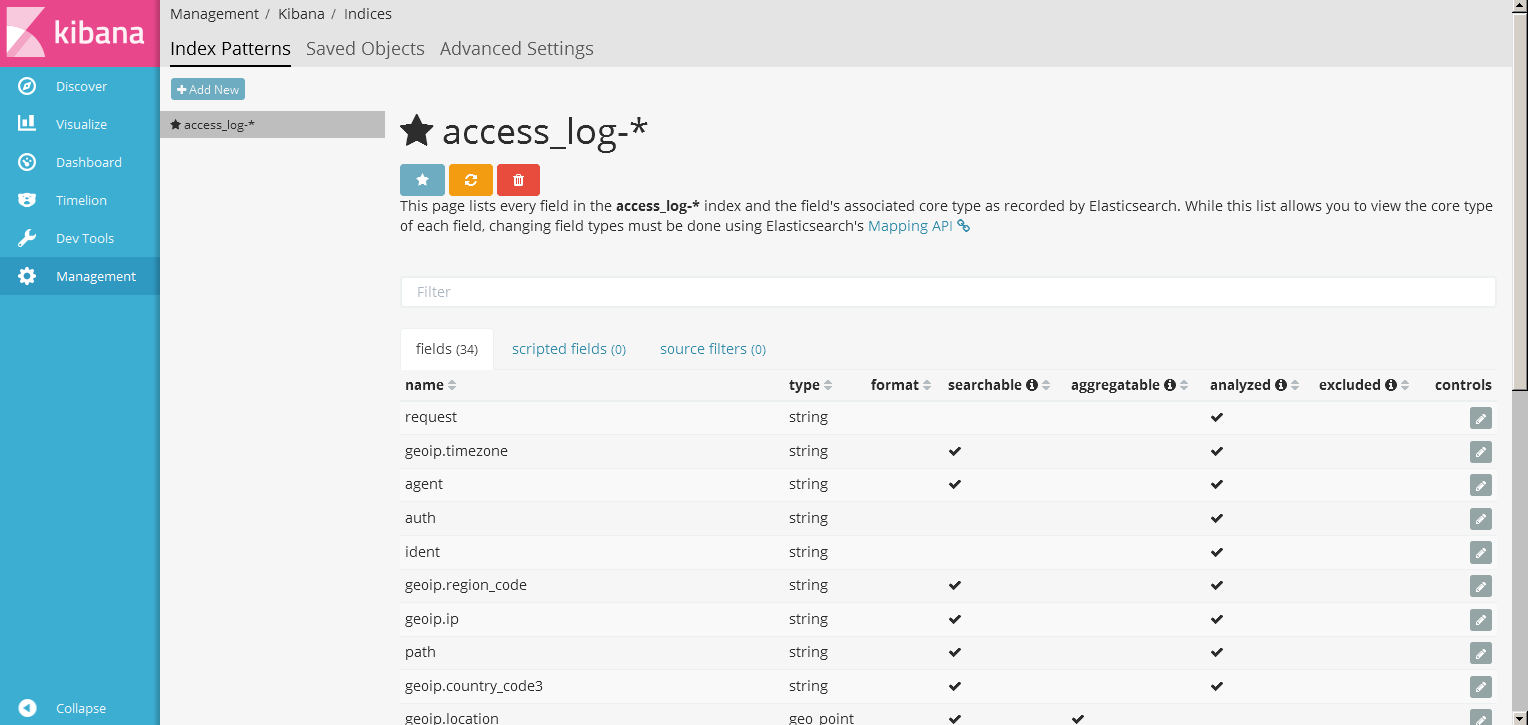 しっかりと fields が登録されましたね。この画面では、field の項目が analyzed かどうかも確認する事ができます。
テンプレートを作成する際、ここの項目を見ながら微調整すると良いかもしれません。(今回はさっぱりとした内容なので深掘りはしません。)
また、geoip.location の type が geo_point になっている事もわかります。(あれだけキモだと説明しておいて geoip.location 見切れててすいません。)
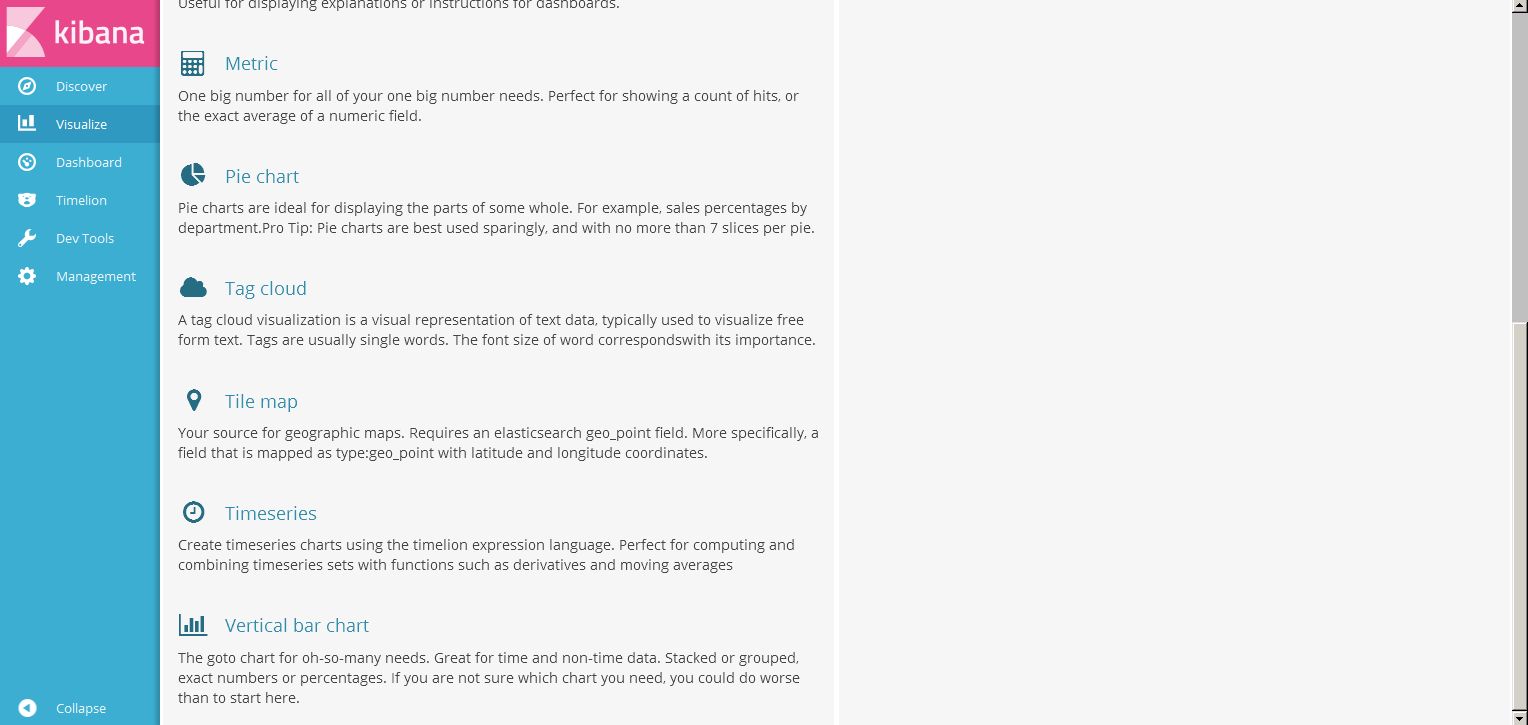 早速 Visualize に移り、Tile map を選択します。
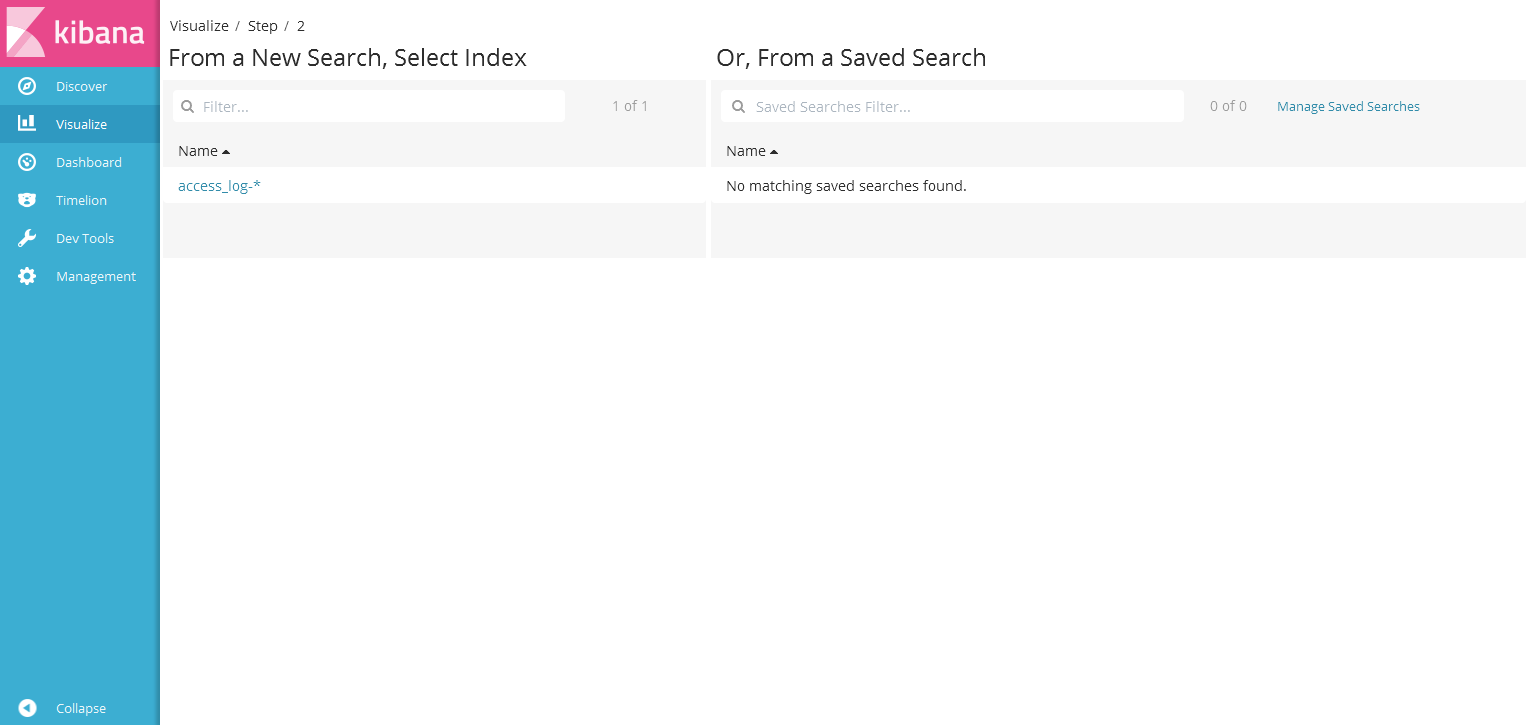 今回作成した "access_log-*" を選択。
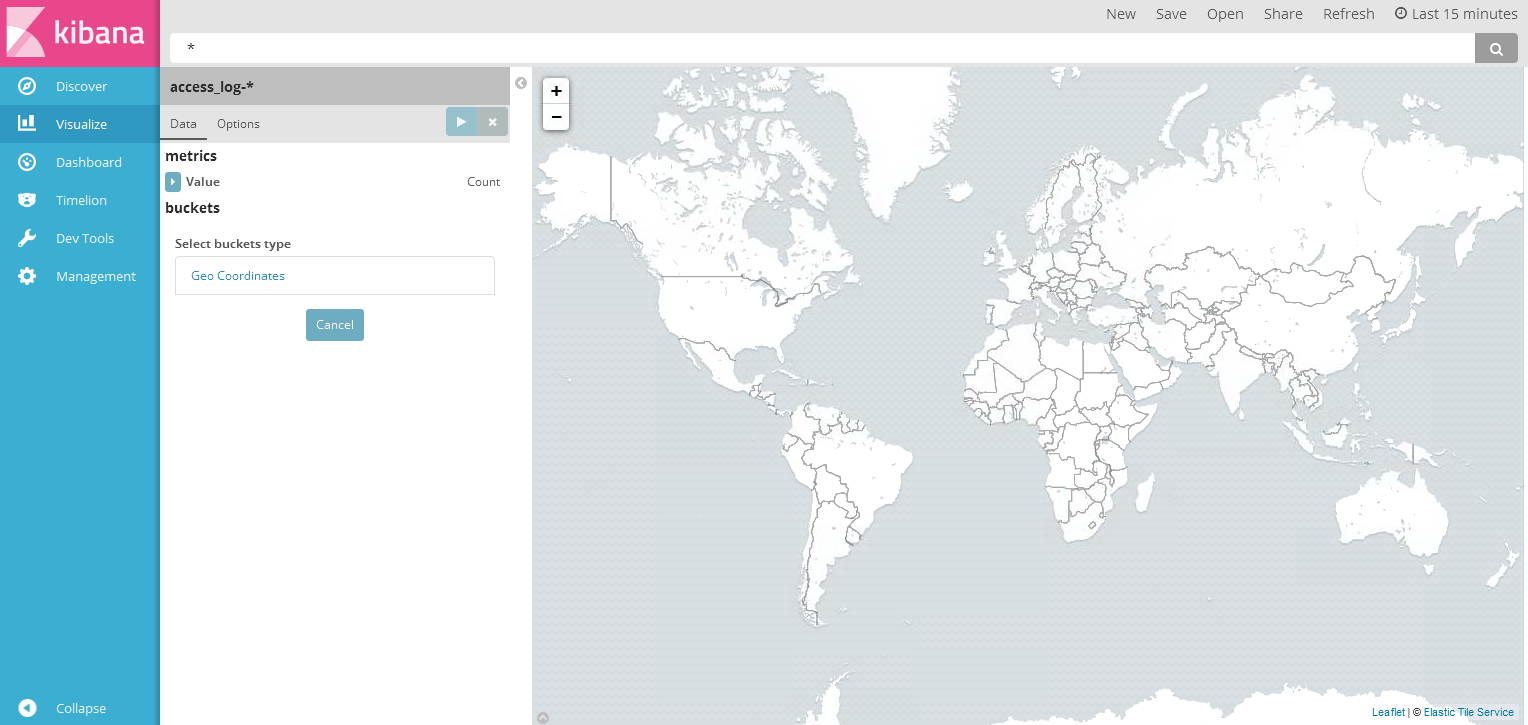 世界地図でました。もうここまで来ると楽しい。
buckets の select buckets type で Geo Coordinates を選択。
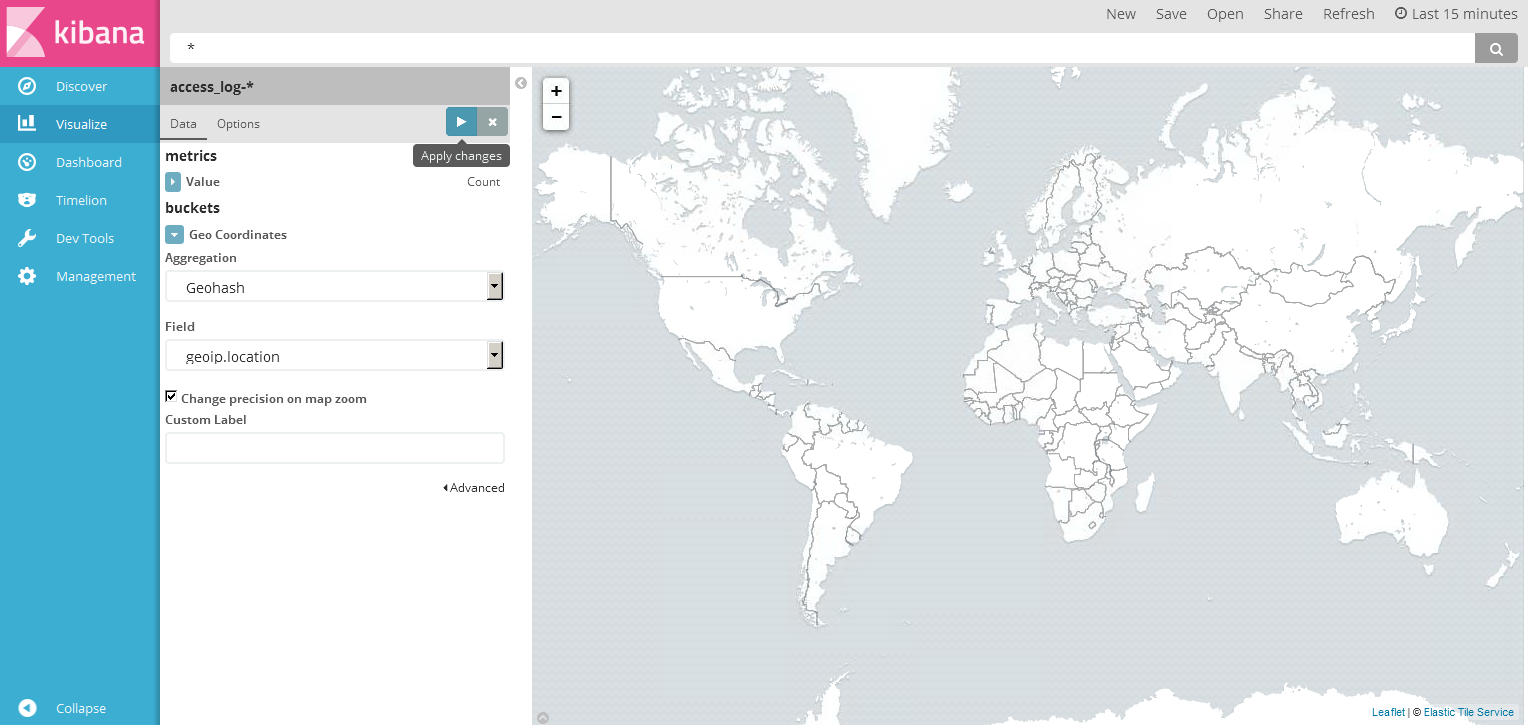 Field に geoip.location が認識されている事が確認できます。
右向き三角 (Apply changes) をクリックして変更を適用。
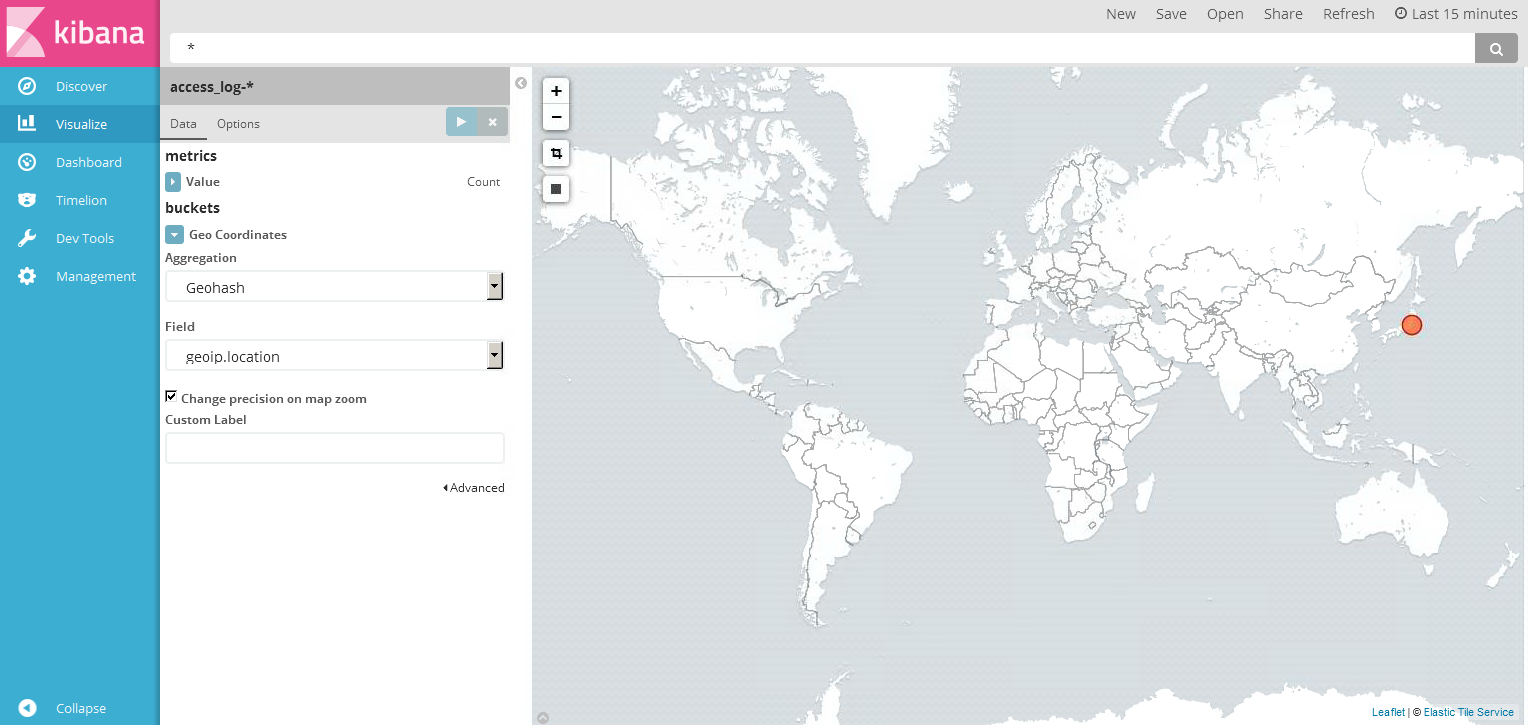 お、おおおおおおおお!日本の IP アドレスからアクセスが来ている事がわかります!
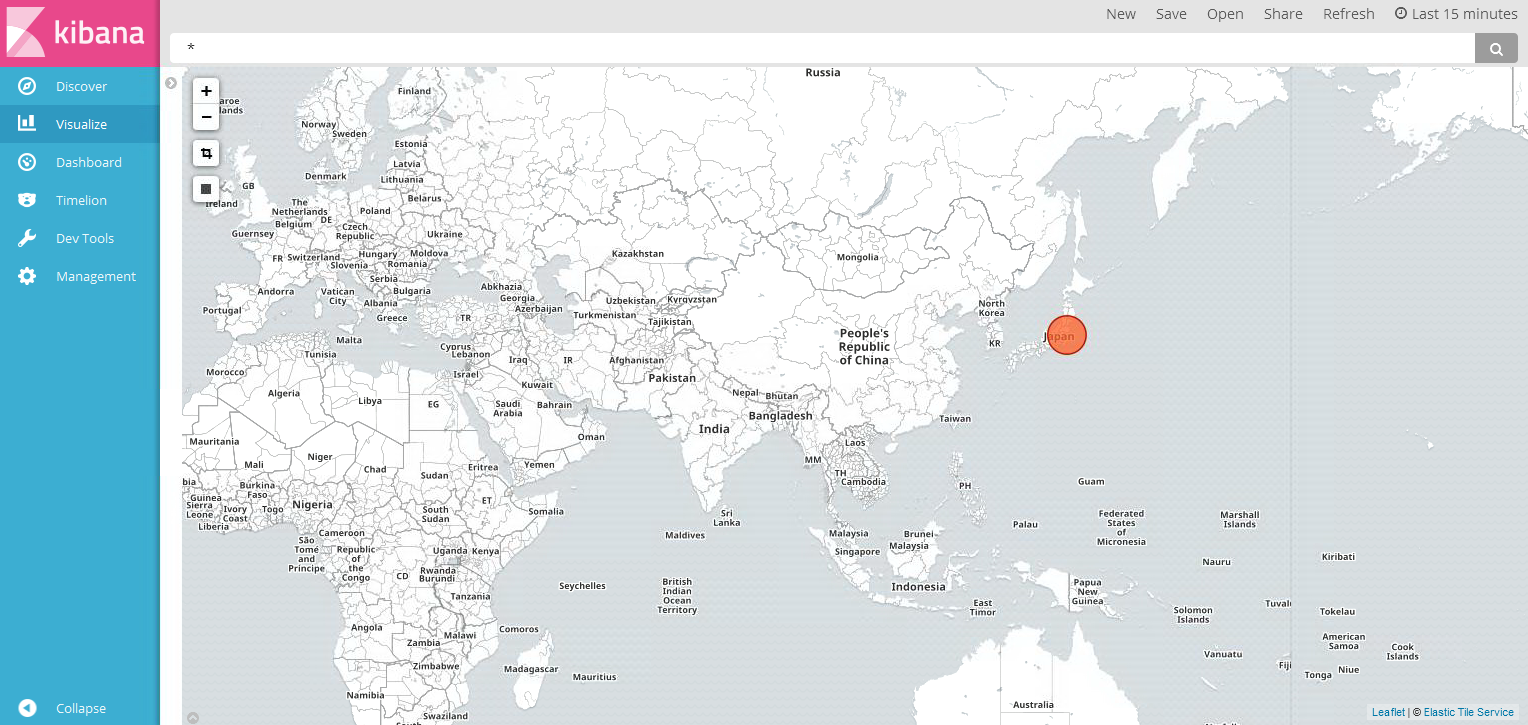
ズーム。
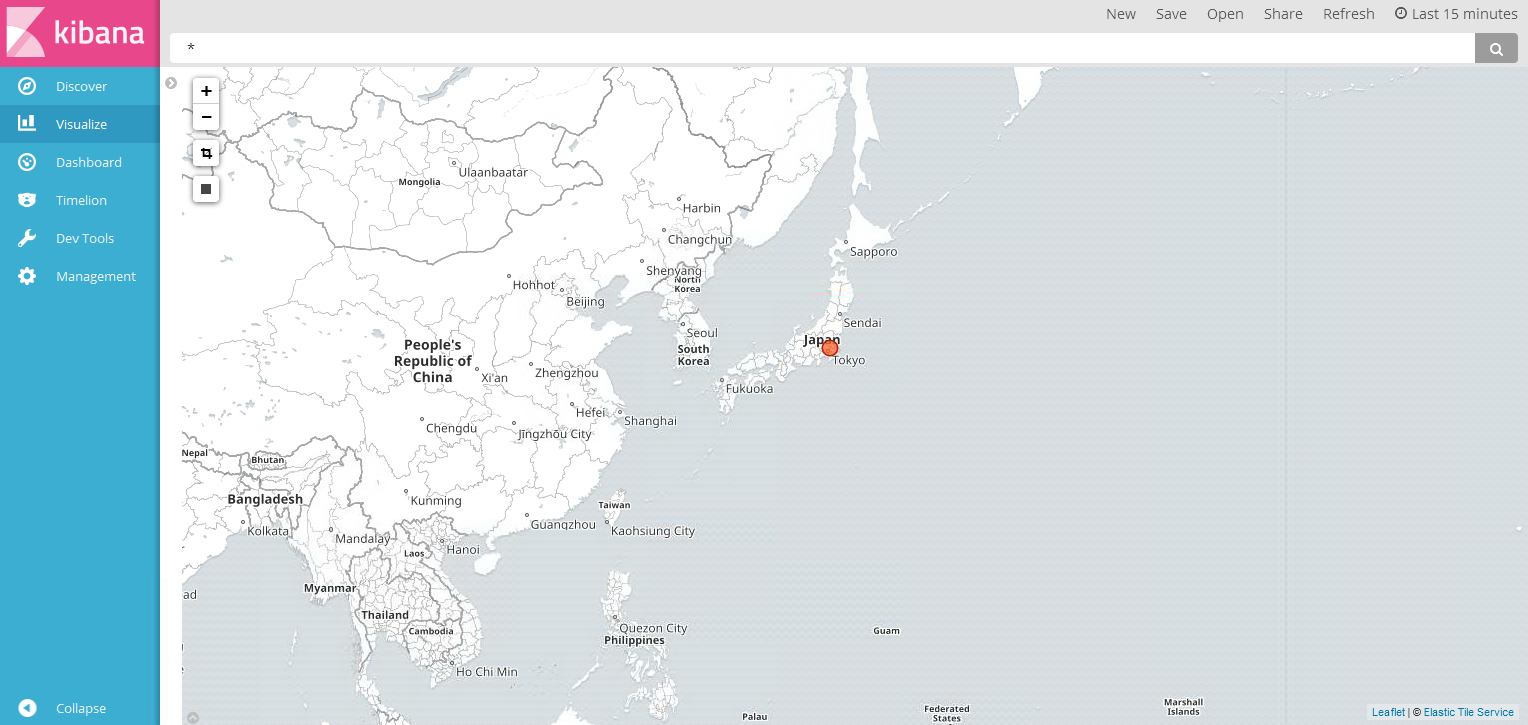 ズーーーーム。w
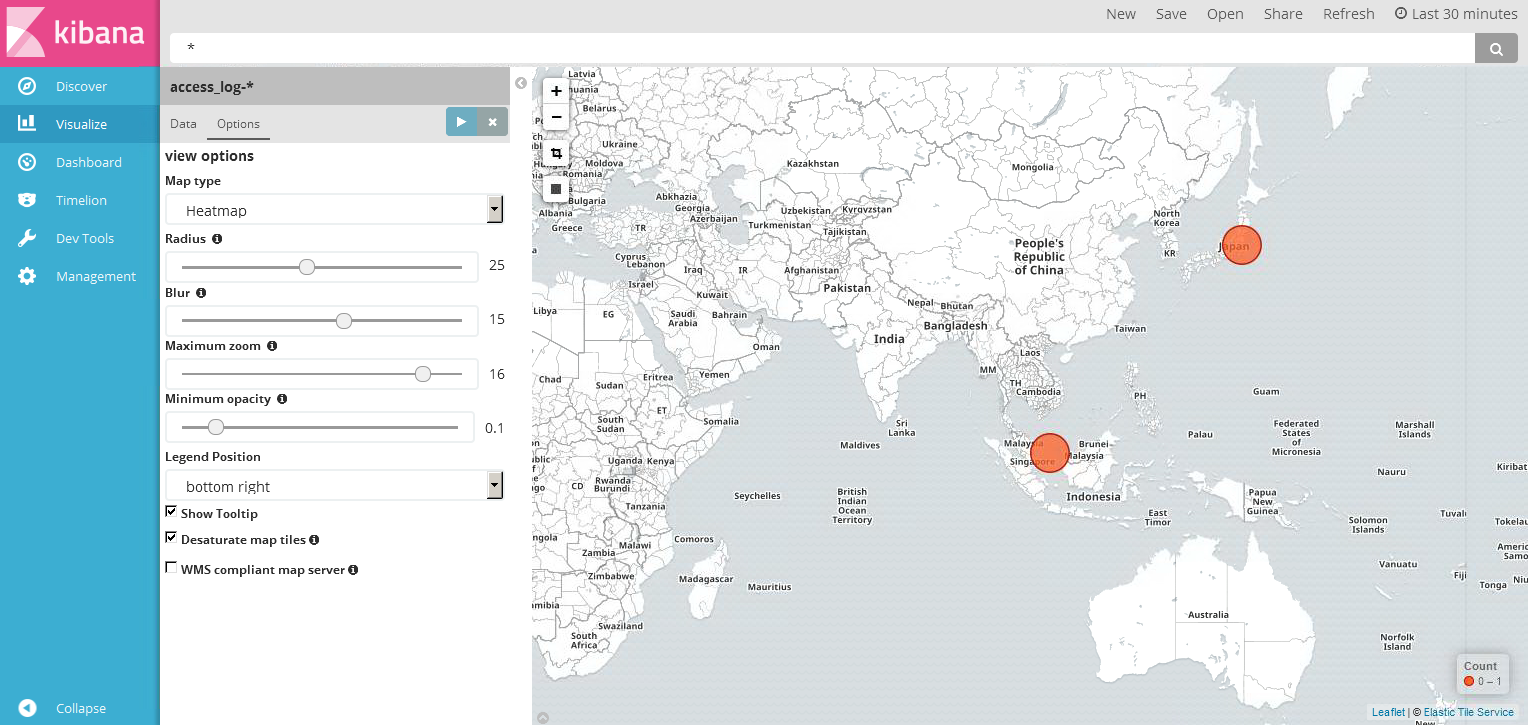 Heatmap も使おうと思い遊んでいると、ふと気づく。
なんかインドネシアらへんからも接続しにきている!これはテンションあがります。
適当に HTTP オール開放した Apache なので、いろんなところからアクセスしに来るんですね。
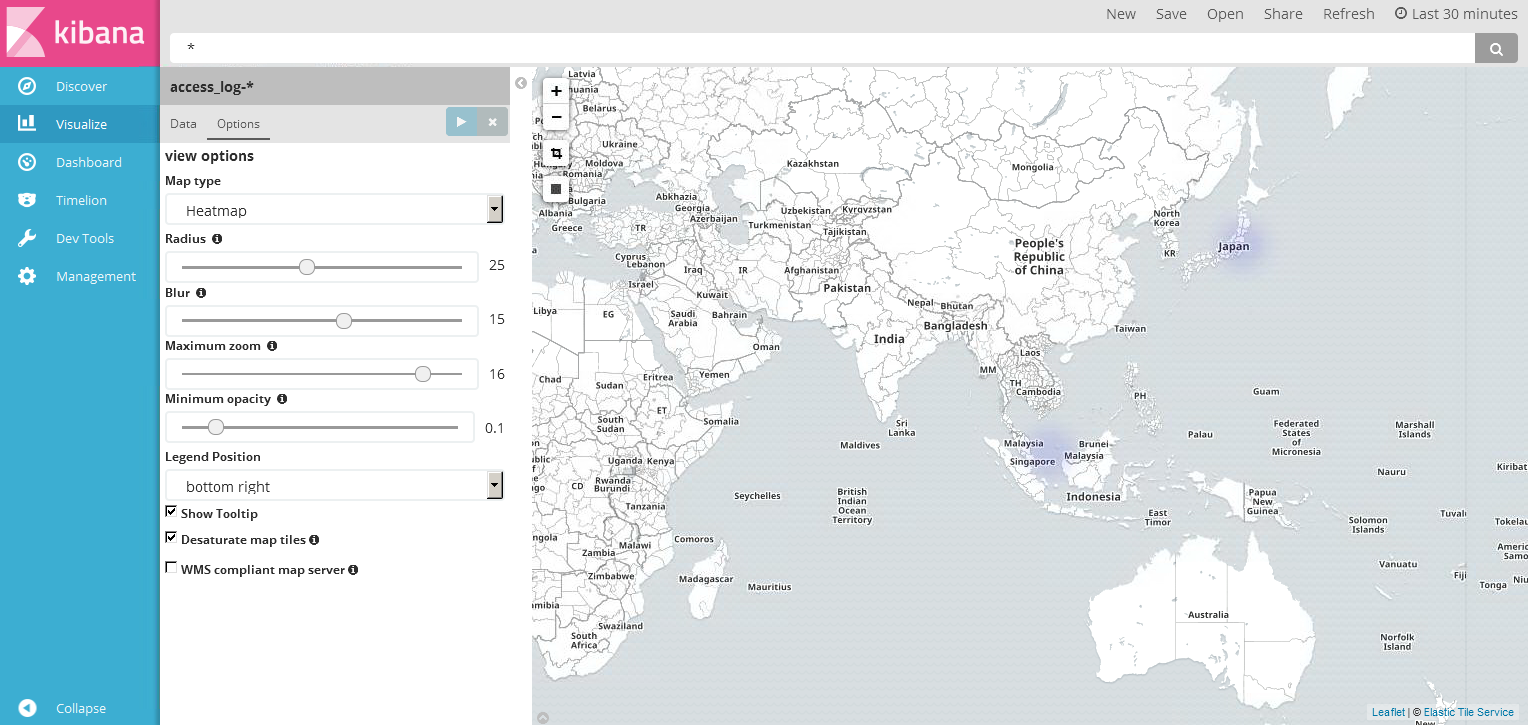 Heatmap にするとこんな感じです。
まだまだ他にも色々なオプションがあるので、さらに使い倒していきたいですね。
まとめ
ELK についてまだ慣れていない部分がたくさんありますが、Logstash の知見も増やしていきたいですね。
一般的なログ形式であれば Elasticsearch にマッピングしてもらえばいいですが、テンプレート作成ができるようになればさらに可能性が広がる事を再認識しました。
次は、IIS ログに挑戦しようかなと考えています。構成としては nxlog → ELK といった感じです。
本ブログについて間違いなどありましたらご指摘いただけるとありがたいです。
投稿者プロフィール

-
AWS認定12冠
趣味 : スプラトゥーン
最新の投稿
 AWS2025年1月5日Migration Evaluator について調べてみた
 AWS2024年1月9日Amazon S3 Express One Zone を使ってみた
 マイグレーション2024年1月9日AWS Migration Hub を使ってみた
 AWS2024年1月9日AWS Application Discovery Service (ADS) を使ってみた